


Your ZenCast account comes with an inbuilt set of detailed analytics so you can track what's happening with your shows. Any time you need to access this feature you can do so from the upper-left corner of the ZenCast dashboard:

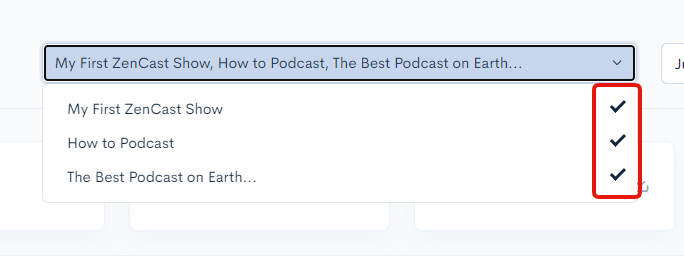
If you have multiple shows, you'll be able to select which ones you'd like to see statistics for. Click the drop-down menu in the top centre of the screen and select any combination of your shows to view their stats together or individually:
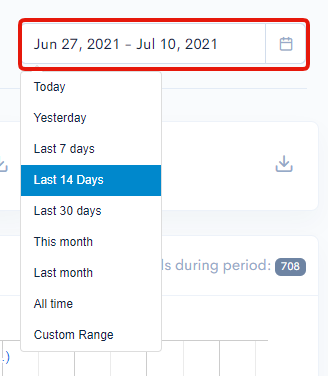
To the right of the show selection, you'll see the date range for the currently displayed stats. Click on this to bring up a drop-down menu and select a new date range:
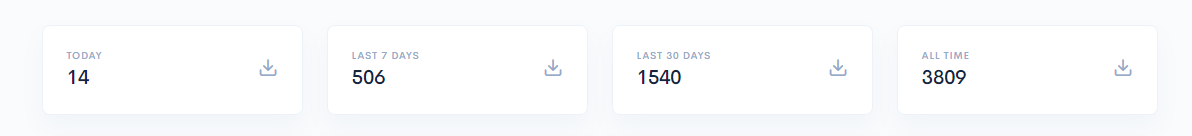
Underneath these is a simple breakdown of your show downloads/listens for today, the last 7 days, the last 30 days, and all-time since the show was launched:
The Daily downloads graph shows one bar per day. Depending on what date range you're viewing, you'll also notice that recent episode publish dates are shown so you can see how these correlate to your listening numbers.
The total number of downloads during the chosen date range is also shown in the top-right:
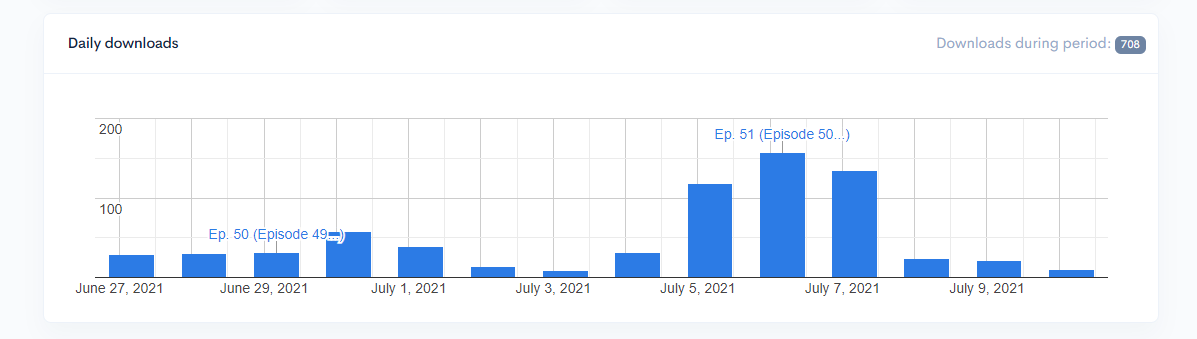
With all the bar charts you can hover the mouse over them to get exact numbers for each bar.
Next is the performance of Recent episodes:
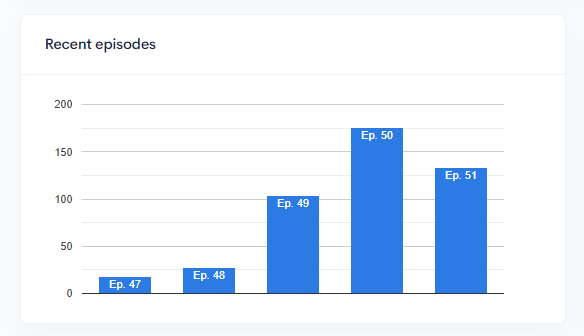
This shows the number of downloads, per episode, for the last 5 episodes published.
The next graph shows your podcast's top 5 most popular episodes:
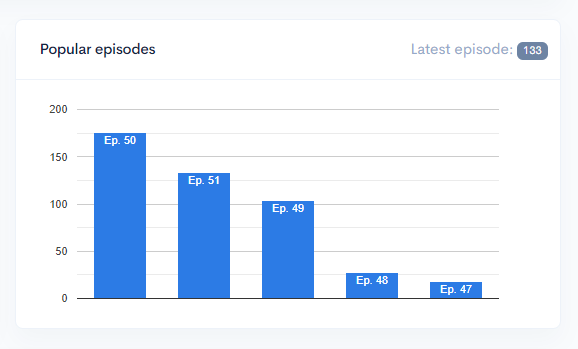
For comparison, the downloads for the most recent episode are shown in the top right corner.
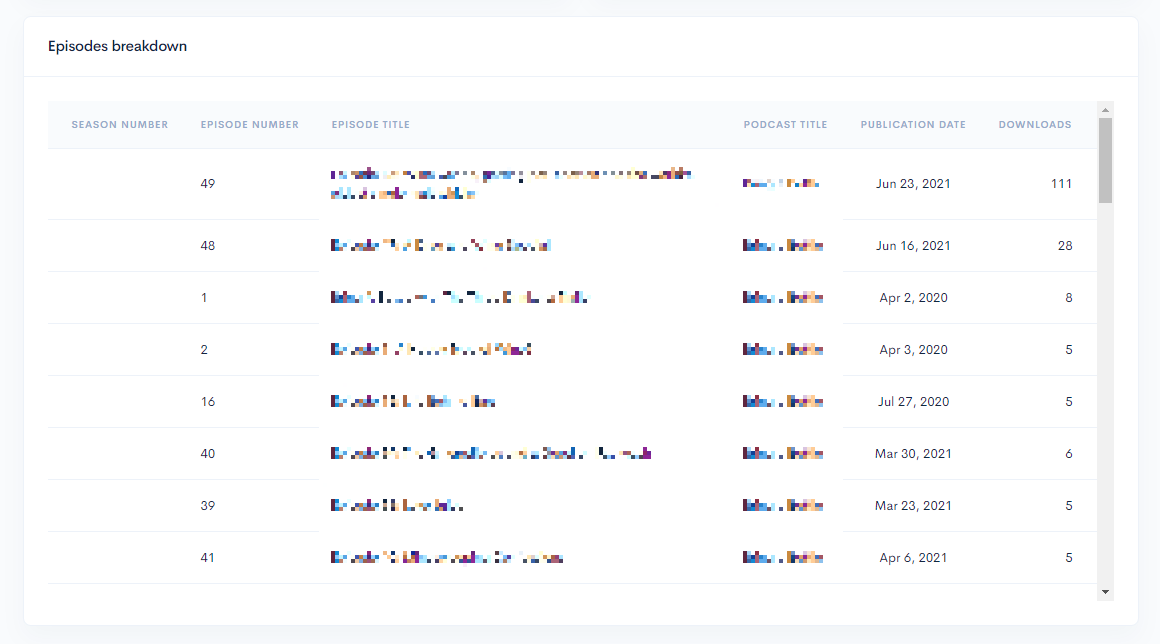
The Episodes breakdown shows download numbers for every single episode and can be sorted by Season, Episode number, Title, Podcast, Publication date, and number of Downloads by clicking on the column headings.
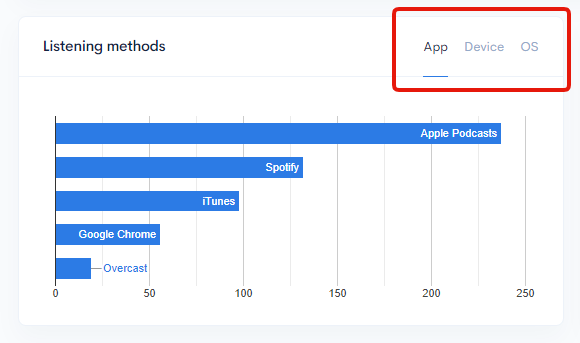
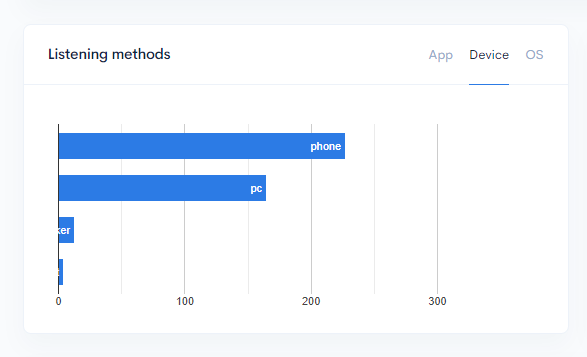
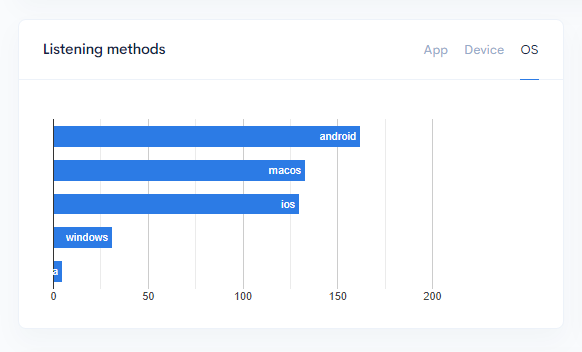
The Listening methods section shows downloads by App, Device, and Operating System, selected from the tabs in the upper-right corner:
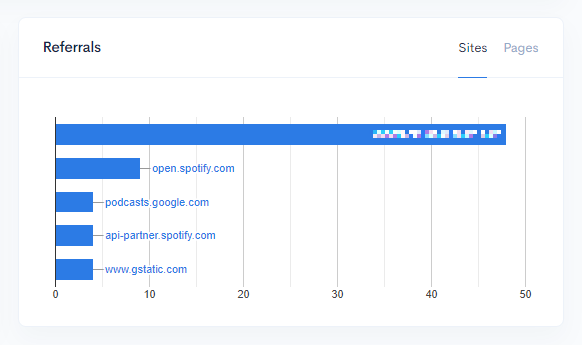
The Referrals section counts plays on the embedded ZenCast player, and can be sorted by site or page:
Finally, at the bottom of the page is Downloads by location, broken down by country:
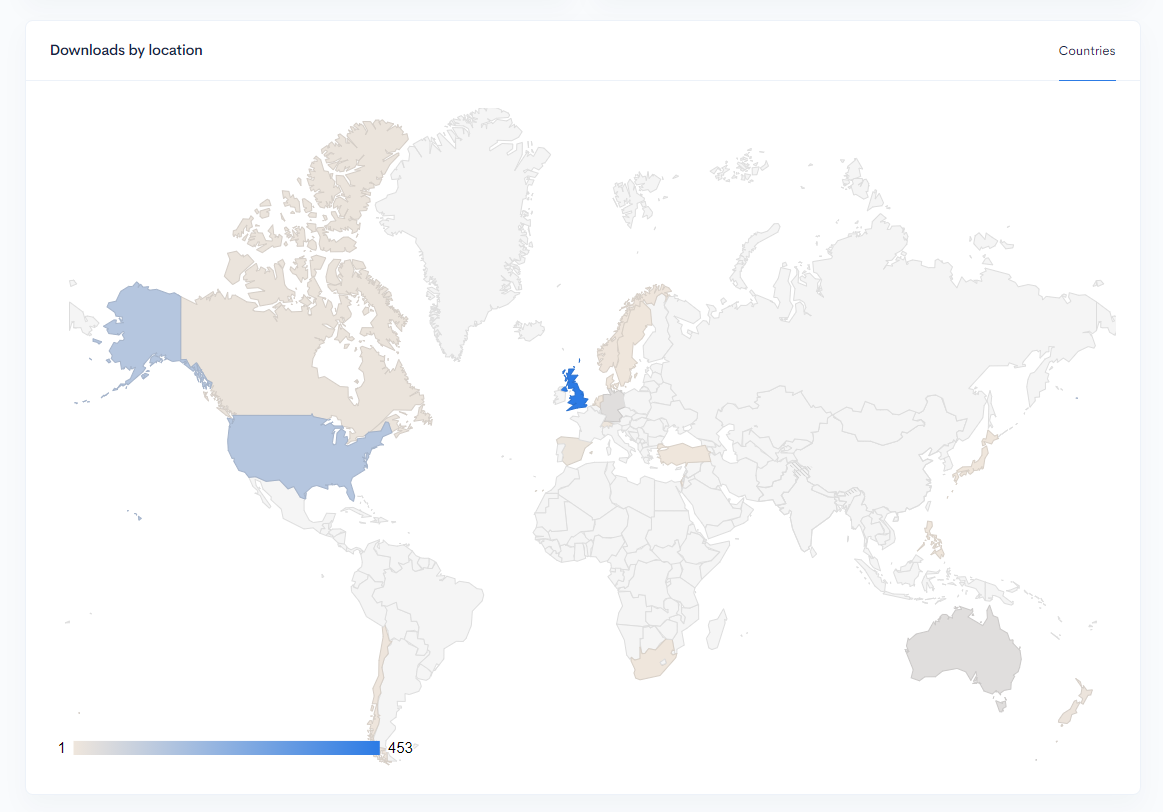
Regions on the map are progressively shaded from light tan color (least downloads) to dark blue (most downloads).
Regions with zero downloads are shaded with light grey.
A couple of hints for getting more out of your show's statistics:
- Keep in mind the data on each chart will adjust to the date range selected at the top of the page
- For more specific info, hover the mouse over bars and regions on the charts to see a popup with exact figures
If you have questions about show statistics feel free to get in touch using the chat bubble and we'll be happy to help.